Data highlight
December 1, 2020
Small businesses continue to experience operational and financial challenges due to the pandemic.
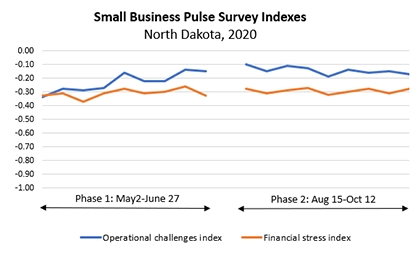
In addition to providing survey responses for individual questions of the U.S. Census Small Business Pulse Survey, the U.S. Census Bureau also calculates a number of indices to better represent a set of similar questions.
• The Operational Challenges Index – assesses the overall effect of the pandemic on business operations. Negative values (up to -1) of the index indicate a negative effect on operations (the negative effect worsens as the index value approaches -1), while zero indicates little or no effect. Operational challenges include decreased revenue, temporary or permanent closure, decreased hours of operation, and supply chain disruptions.
• The Financial Stress Index – assesses the financial difficulties experienced by businesses. Negative values (up to -1) of the index indicate a negative financial impact (the negative effect worsens as the index value approaches - 1), while zero indicates little or no effect. Financial challenges include decreased cash available for business operation, missed loan or other scheduled payments, and request for financial assistance.
The Small Business Pulse Survey completed two phases of data collection (Phase 1 from end of April 2020 to end of June 2020 and Phase 2 from beginning of August to end of October) and is currently collecting data in phase three (starting with November).
Since the beginning of the pandemic, small businesses slightly recovered towards the end of Phase 1 (end of June) and beginning of Phase 2 (early August). However, after that, due to the new pandemic wave, the recovery is stalling. The values for both, the Operational Challenges Index and Financial Stress Index remained fairly constant in Phase 2.
November 1, 2020
Nearly one-third of North Dakota small businesses report undergoing large negative effects due to the pandemic.
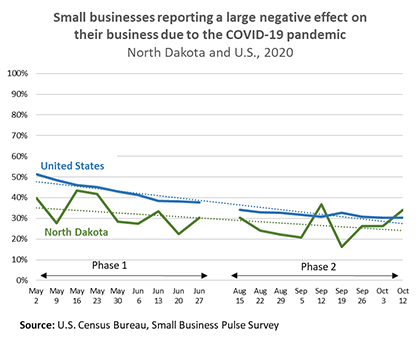
In addition to its impact on public health, the Coronavirus pandemic (COVID-19) has severe impact on the economy. The U.S. Census Small Business Pulse Survey (Business Pulse) provides essential real-time data on the challenges small businesses are facing during the Coronavirus pandemic. The Business Pulse Survey collected data in two phases. Phase one collected data from end of April 2020 to end of June 2020. Phase two continued to collect data since the beginning of August.
For most of the data collection period (April to October), the percentage of North Dakota businesses reporting large overall negative effects on their business was smaller than the U.S., and about 30 percent in average. According to the most recent data collection (Oct. 4 to Oct. 12, 2020), 34 percent of North Dakota small businesses reported large negative effects of the pandemic on their business, 38 percent reported moderate negative effects, and 23 percent reported little or no effects. In addition, the Business Pulse Survey provides a lot of data on the impacts of the pandemic on revenues, employees, supply chain, finances, and operations.
Information about impacts of the pandemic on small businesses can help policymakers and service organizations better design and target programs to help small businesses impacted by the Coronavirus. In addition, the information may aid businesses in making economic decisions and assist researchers studying the effects of the pandemic.
Notes: Dates shown in the chart represent the last day of the week that the data were collected. For example, data displayed under Oct 12 were collected between 10/04/2020 and 10/12/2020. No data were collected between 6/27 and 8/9, 2020.
Small businesses responded to the question: "Overall, how has this business been affected by the COVID-19 pandemic?" with the following possible answers: large negative effect; moderate negative effect; little or no effect; moderate positive effect; large positive effect.
Small businesses were defined as any nonfarm, single-location employer businesses with fewer than 500 employees and annual revenue $1,000 or more in the 50 states, District of Columbia, and Puerto Rico.
OCTOBER 1, 2020
Impact of COVID-19 on North Dakota’s households.
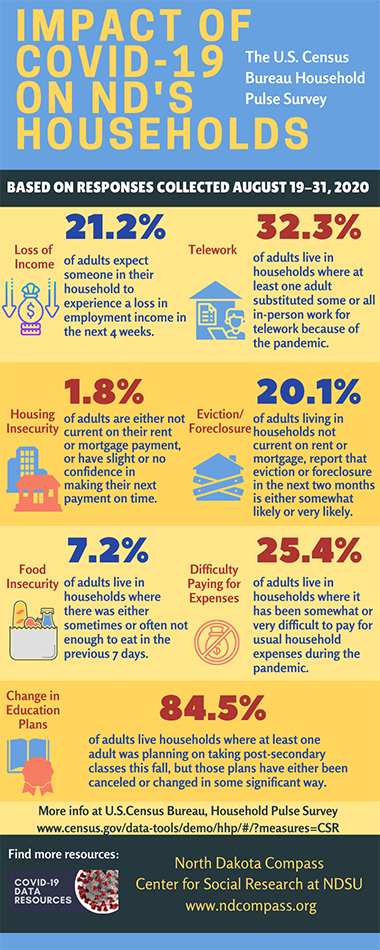
The new experimental U.S. Census Bureau’s Household Pulse Survey is designed to quickly and efficiently deploy data collected on how people’s lives have been impacted by the coronavirus pandemic. The survey collected data in two phases: Phase 1 (April-July 2020) and Phase 2 (August 19, 2020 through October, 2020).
Below are some highlights of the results based on data collected August 19 - August 31, 2020 in North Dakota.
- Expected loss in employment income – The health and economic crisis caused by the COVID-19 pandemic resulted in the loss of employment income for many people for a variety of reasons. In North Dakota, 38 percent of adults live in a household where someone experienced a loss in employment income since March 13. Moreover, one in five adults (21.2%) expect loss of employment income in the next four weeks, for self or a family member. The U.S. average is 26.2 percent.
- Telework – The pandemic disrupted normal work patterns with impacts not only on the workplace but all aspects of life. People in jobs that allowed for remote work, while fortunate to not lose their jobs and work safely from home, still experienced many challenges. In North Dakota, about one in three adults (32.3%) live in households where at least one adult substituted some or all in-person work for telework because of the pandemic. The U.S. average is 36.3 percent.
- Housing insecurity – Some households were impacted in their ability to pay their mortgage or rent on time. North Dakota has the lowest percentage in the nation of adults who are not current on rent or mortgage payments, or have slight or no confidence that their household can pay next month’s rent or mortgage on time (1.8%). The U.S. average is 7.2 percent. Moreover, one in five adults living in households not current on rent or mortgage in North Dakota (20.1%) report that eviction or foreclosure in the next two months is either somewhat likely or very likely. For comparison, the U.S. average is 33.4 percent.
- Food insecurity – Food security (having access to a sufficient quantity of affordable, nutritious food to eat) is an important measure of well-being. In North Dakota, 7.2 percent of adults live in households where there was either sometimes or often not enough to eat in the last seven days. The U.S. average is 10.1 percent.
- Difficulty paying for usual expenses – Many people are dealing with serious financial hardship caused by the pandemic. One-fourth of adults in North Dakota (25.4%) reported it being somewhat or very difficult to pay for usual household expenses during the coronavirus pandemic. The U.S. average is 31.9 percent.
- Change in postsecondary education plans – Households were impacted by disruptions in the education system during the pandemic. Due to stay-at-home orders, children were not able to attend school in-person and many schools used alternate methods of continuing course work. In addition, plans to continue education were impacted for many household members. In North Dakota, 84.5 percent of adults reported at least one adult in their household was planning on taking post-secondary classes this fall, but due to the pandemic, these plans have either been canceled or changed in some significant way. The U.S. average is 80.9 percent.
SEPTEMBER 1, 2020
The higher the income, the lower the percentage of adults diagnosed with diabetes in North Dakota.
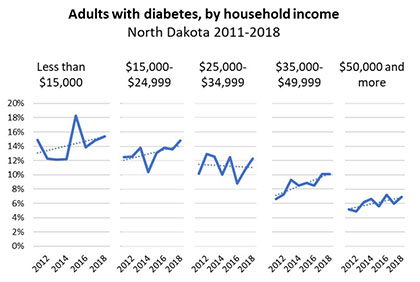
Nearly one in ten of North Dakota’s adults (age 18 and older) had diabetes in 2018 (9.4%). Nationally, North Dakota ranked 11th (from lowest to highest diabetes rate) among the 50 states, for adults diagnosed with diabetes. The diabetes rate for adults in North Dakota slightly increased from 8.2 percent in 2011 to 9.4 percent in 2018 and trended below the national average for this time period.
Specifically in North Dakota , the prevalence of diabetes is highest among those with the lowest household income and decreases as income increases. Diabetes rates show an increasing trend for most income levels for the 2011-2018 time period. Compared to 2011, diabetes rates increased for adults in all income groups with the highest increase for adults with an annual household income from $35,000 to $49,999. Increases in diabetes rates among adults have been described by the CDC as a major public health threat. Curbing the increase in diabetes is important especially now, during the COVID-19 outbreak, as the CDC included diabetes among conditions that increase the risk of severe illness if contacting the virus.
AUGUST 1, 2020
The age structure in North Dakota is changing.
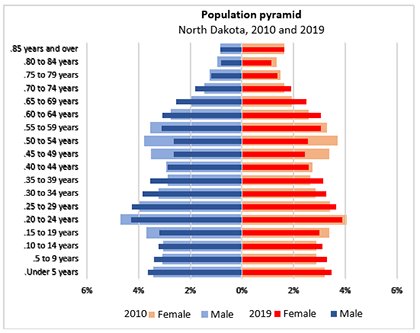
Recently, the U.S. Census Bureau released population estimates by age and sex, for the U.S., 50 states, and District of Columbia. The age and sex composition of a population reflects changes in fertility, mortality, and migration and is often displayed using a population pyramid. A population pyramid is composed of two bar charts turned on their sides, that present in five-year age increments, the percentage of males in total population on the left side and the percentage of females in the total population on the right side. Understanding the distribution of various age groups in a population is important for the society and the economy. For instance, a top-heavy pyramid (i.e., an older population) in a community suggests an aging of the population, which may cause implications for economic development, workforce, and service programming. A bottom-heavy pyramid (i.e., much younger population) suggests potential for growth, but also an increased need for jobs, housing, childcare, and education.
Impacted by migration and the aging baby boomers, the age structure in North Dakota changed from 2010 to 2019. Energy development in the western part of the state attracted young people for work. The influx of young people in their prime child-bearing years led to an increase in the number of young adults and an increase of the number of births. Therefore, the percentage of children (0 to 14 years old) and the percentage of young adults (25 to 39 years old) in the total population, increased from 2010 to 2019, for both males and females.
The aging of the baby boom generation, those born from 1946 to 1964, influenced the top half of the pyramid, as the oldest of this cohort turned 65 in 2011. Therefore, we can see an increase in the percentage of people 60 to 74 years old in the total population. This increase was offset by the loss of people ages 45 to 59 years old, or people aging out of this age group into the next group. The loss of the people 45 to 59 years old, which represent the most common age group of potential caregivers, contributed to a declining caregiver ratio (the ratio of the number of people in the most common caregiving age range divided by the number of older people most at risk of needing long term services and supports), with implications for the long-term care of older adults.
These changes bring both opportunities and challenges that could have consequences for the society and the economy. The increase in the number of births has multiple implications as communities address current and future demand for childcare, youth programs and activities, and schools. The increase in the number of older adults will have a significant impact on programs and services for the elderly, the health care system, housing stock, and more.
VIEW TOPIC:DEMOGRAPHICS/AGE
JULY 1, 2020
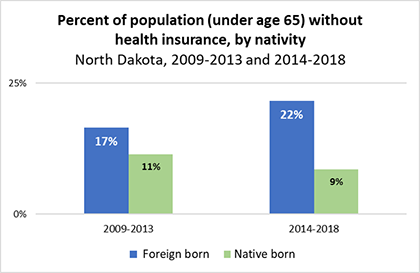
The gap widened between foreign-born and native-born population who lack health insurance in North Dakota.
Health insurance is the best way to ensure access to health care in the United States. Uninsured individuals are less likely to receive preventive care or care for routine medical conditions and injuries. Lack of preventive health care and lack of treatment for medical conditions can lead to more serious illnesses and health problems. This in turn, can result in preventable hospitalizations and deaths.
North Dakota ranks mid-range (21st lowest uninsured rate) among the 50 states in the U.S. with an uninsured rate of 8 percent, which is a slightly lower rate than the U.S. rate of 10 percent.
According to the American Community Survey (ACS) 5-year estimates, in 2018, there were 27,785 foreign born people, younger than 65 years, living in households and non-institutional group quarters in North Dakota. Foreign born are considered those who were not U.S. citizens at birth and excludes people born in the United States, Puerto Rico, or U.S. Island areas as well as those born in a foreign country who had at least one parent who was a U.S. citizen. Among North Dakota’s foreign-born residents as defined above, 5,997 people or 22 percent lacked health insurance in 2014-2018. The percentage of foreign born with no health insurance increased from 17 percent in 2009-2013, according to the ACS 5-year estimates.
In comparison, the percentage of native-born population who lack health insurance decreased from 11 percent in 2009-2013 to 9 percent in 2014-2018, widening the gap between foreign-born and native-born population who lack health insurance.
The lack of health care coverage affects everyone in a community. Those without health insurance feel the direct physical, mental, and financial effects of not having health care coverage, while the insured are affected indirectly through higher health care premiums and higher taxes.
Note: Individuals without health insurance are those who, at the time of the survey, lacked comprehensive health coverage through: a current or former employer or union; insurance purchased directly from an insurance company; Medicare, Medicaid, Medical Assistance, or any kind of government-assistance plan for those with low incomes or a disability; TRICARE or other military health care; or Veterans Administration (VA) (including those who have ever used or enrolled for VA health care). Note that coverage solely by the Indian Health Service (IHS) does NOT count as health insurance; i.e., people who were only covered by IHS in the previous year are counted as uninsured.
VIEW TOPIC:HEALTH/ HEALTH CARE COVERAGE
JUNE 1, 2020
Ambulatory and hearing are the most common disabilities in older adults in North Dakota.
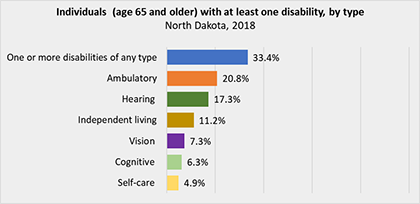
One in three people age 65 and older in North Dakota have at least one disability, according to data collected by the U.S. Census Bureau, American Community Survey (ACS). Although disability is not an inevitable consequence of aging, with increasing age, disabilities become more common due to compounding health related concerns, such as chronic diseases.
Of the 36,832 older adults in North Dakota who have some form of disability, 62 percent of them report difficulty in walking or climbing which is counted as ambulatory disability. The older adults who report having an ambulatory disability represent 21% of the civilian non-institutionalized population of age 65 and older.
Of the 36,832 older adults in North Dakota who have some form of disability, 62 percent of them report difficulty in walking or climbing which is counted as ambulatory disability. The older adults who report having an ambulatory disability represent 21% of the civilian non-institutionalized population of age 65 and older.
Serious difficulty hearing is the second-most cited disability (17% of the civilian, non-institutionalized population age 65 and older), followed by difficulty with independent living – doing errands alone such as visiting a doctor’s office or shopping (11%), serious difficulty seeing (7%), cognitive difficulty (6%), and difficulty taking care of themselves such as bathing or dressing (5%).
These types of disabilities in older adults vary by county. This data visualization shows the variation of disability rate by type and by county. Understanding the older adult population with disabilities allows communities to better align services to meet upcoming and/or current needs and can also help older adults to maximize their independence and utilize their talents and abilities.
VIEW TOPIC:AGING/ DISABILITY
MAY 1, 2020
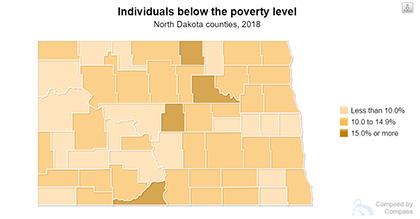
As the pandemic is affecting the most vulnerable members of our communities, it is now especially important to consider how much the poverty rate in North Dakota varies by county.
According to Centers for Disease Control and Prevention (CDC), some socioeconomic and environmental factors (e.g., poverty, lack of medical insurance, lack of access to transportation or nutritious food) are among risk factors regarding the novel COVID-19, since they could potentially contribute to an increased risk of people becoming sick or recover from an illness.
Under the current conditions, when most communities are impacted by the COVID-19 pandemic, it is very important to consider areas with people in poverty since they are more likely to work in jobs with a high risk to exposure, live in insecure housing, lack health insurance, and live in areas with less access to health care.
In North Dakota, about one in ten people are considered to live below the poverty level (10.7 percent , 2018 data). Poverty refers to a state in which an individual lacks the monetary resources to afford basic human needs, such as clean water, nutrition, health care, education, clothing, and/or shelter. The lack of these resources makes it difficult to reach a minimum standard of living or wellbeing deemed acceptable by society. While there are different approaches to measuring poverty in the United States, the official poverty measure uses a set of income thresholds that are the same across the United States but vary by family size and composition and are adjusted annually for changes in the cost of living*. North Dakota’s poverty rate is lower than the United States’ poverty rate of 13.1 percent and ranks North Dakota 11th (from lowest to highest rate) among the 50 states.
By county, poverty rates in North Dakota range from 6.5 percent in Williams County to 32.9 percent in Sioux County, with eight counties having a poverty rate above the national average. Compared to 2010, poverty estimates appear to have decreased in the majority of the counties. However, a more in-depth examination revealed that with the exception of two counties (Grant Forks and McKenzie) the decrease of the poverty rate is not statistically significant, meaning that the change may be attributed to chance alone. Therefore, data such as these should be examined more thoroughly so the policy makers and community and social service organizations can better understand, target, and serve populations at risk and impacted by COVID-19 throughout North Dakota.
*The official poverty rate reported by the Census Bureau measures the percentage of the U.S. population with total income below the federal poverty threshold for their family size (e.g., $25,926 in 2019 for a family of four people with two children). Income is calculated before taxes and includes only cash income, such as earnings, pension income, investment income, social security, unemployment benefits, and child support payments. Other federal and state benefits that help support low-income families such as Supplemental Nutrition Assistance Program (SNAP) benefits, tax benefits (e.g., Earned Income Tax Credit, Child Tax Credit) and housing subsidies are not counted as income under the official poverty measure.
APRIL 1, 2020
North Dakota ranks 19 among the 50 states (from lowest to highest rate) in youth obesity rate.
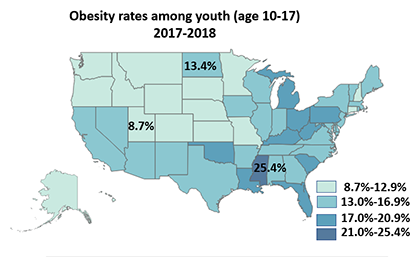
The national obesity rate for youth, ages 10 to 17, was 15.3 percent, according to the most recent data from the National Survey of Children’s Health (2017 and 2018 data combined). Children and youth are considered obese if they have a Body Mass Index (BMI) at or above the 95th percentile for children and youth of the same age and sex. Nationwide, the obesity rate ranged from 8.7 percent in Utah to 25.4 percent in Mississippi, North Dakota ranking 19th (from lowest to highest obesity rate) among the 50 states.
In North Dakota 8,482 youth (ages 10-17) are obese. This represents 13.4 percent of the youth population in this age group. In addition, another 8,714 youth are overweight, referring to those who have a BMI of 85th percentile to 94th percentile (13.7%). The obesity rate in North Dakota is lower than the national rate, but the difference is not statistically significant.
According to the World Health Organization, obesity can be prevented by healthy eating and regular physical activity. North Dakota implemented a number of policies to prevent obesity in children and youth. Some of these are programs that allow and encourage breastfeeding, programs that make drinking water available to children, healthy eating policies, and policies that require physical education for elementary, middle school and high school students.
MARCH 1, 2020
Housing costs are more of a burden for renters than homeowners.
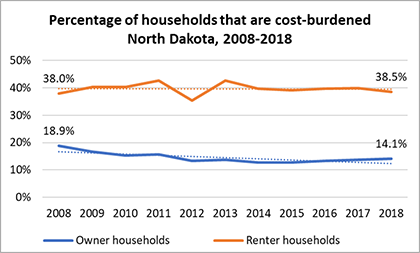
North Dakota ranked 1st in the country with the lowest percentage of households who are housing cost-burdened (i.e., 30 percent or more of the household’s monthly gross income is dedicated to housing costs), at 23 percent, in 2018. Housing costs are substantially more of a burden for renters than homeowners. Thirty-nine percent of renters in North Dakota use 30 percent or more of their income towards housing costs, while 14 percent of home owners are housing cost-burdened. While the percentage of housing cost-burdened homeowners has decreased over the past decade from 19 percent to 14 percent, the percentage of cost-burdened renters has stayed the same. Moreover, there were about 11,000 more cost-burdened renter households in 2018 than in 2008 (a 35% increase from 31,533 in 2008 to 42,491 in 2018).
Households paying a large share of their income on housing are likely to struggle to pay for other basic needs, forcing difficult trade-offs. When more than 30 percent of household income goes towards rent or mortgage payments, people have to make decisions that may result in poorer outcomes in other areas of well-being, such as dropping health care coverage or skipping meals to save on costs.
VIEW TOPIC:HOUSING /COST-BURDENED HOUSEHOLDS
FEBRUARY 1, 2020
North Dakota leads all states in percentage increase in child population over the past 10 years.
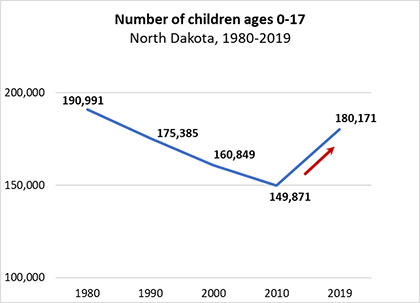
North Dakota’s child population (ages 0 through 17) has changed dramatically during the past 10 years, reversing a decades-long downward trend. The change is due to an increase in the number of births along with in-migration of young families into the state.
After decreasing for many decades, the current growth, which began in 2008, has brought the number of children back to levels not seen since 1990 in North Dakota. From 2010 to 2019, the total child population grew an average of 2.1 percent per year, reaching 180,171 children in 2019, according to the most recent population estimates (U.S. Census Bureau, Population and Housing Unit Estimates, Vintage 2019). Although the pace of growth slowed down after 2015, from 2010 to 2019 North Dakota still had the highest percentage increase of children among 50 states (a 20.2% increase), gaining 30,300 children during this time frame.
VIEW TOPIC:CHILDREN & YOUTH / POPULATION TRENDS
JANUARY 1, 2020
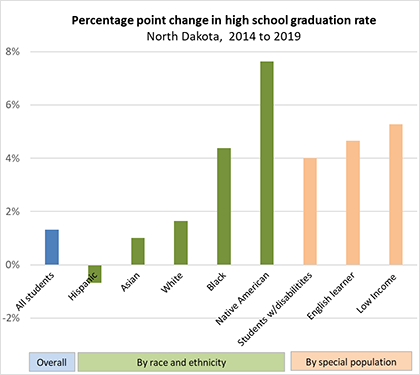
Most historically disadvantaged students showed progress in the on-time high school graduation rate, in North Dakota, in the past five years.
The on-time high school graduation rate is one of the indicators that measure students’ progress towards readiness for college and the workforce
The high school graduation rate overall has been fairly steady the past few years in North Dakota, increasing slightly by 1.3 percentage points from 2014 to 2019. In 2019, 88.3 percent of public high school students graduated on time (i.e., in four years after starting 9th grade for the first time).
Compared to 2014, most student groups saw an increase in on-time high school graduation rate. Among them, Native American students led the progress with a 7.6 percentage point increase in the graduation rate from 2014 to 2019. The graduation rate for black students increased 4.4 percentage points, while the graduation rate for Hispanic students decreased slightly by 0.7 percentage points. Among other groups, the graduation rate increased by 5.3 percentage points for low income students, 4.7 percentage points for English learners, and 4.0 percentage points for students with disabilities.
While progress for the most historically disadvantaged student groups is notable, gaps remain considerable in 2019. Compared to students overall, there is a 16.0 percentage point gap for Native American students; 15.9 percentage point gap for English learners; 14.9 percentage point gap for students with disabilities; and 11.7 percentage point gap for low-income students.
Continued support is needed across the education continuum to sustain progress and continue to reduce the gaps.
VIEW TOPIC: EDUCATION/HIGH SCHOOL GRADUATION
Center for Social Research
North Dakota State University
Compass created by:
Wilder Research
© 2025. All rights reserved.